The US-China Trade Wars and the Solar Industry
Liam Thomas, 5 December 2019Not all tariffs cause trade wars but most trade wars are caused by tariffs. Tariffs are taxes or duties which are levied on particular imported goods making those goods comparatively more expensive than imported or locally-produced goods not subject to tariffs. For example, Country A places a 10% tariff on steel imported from Country B to support the local steelmaking business in Country A. Unless the producer of the steel is willing to accept a lower margin, this has the immediate effect of making the price of the Country B steel rise by 10%. If Country A’s locally-produced steel is cheaper than the imported steel, it’s reasonable to assume consumers will buy the local steel. If Country B retaliates by imposing a tariff or restriction on a product that is imported from Country A, a trade war is underway.
Although the current US-China trade war is widely accepted to have been triggered by the tariffs imposed by the Trump administration, trade tensions between the two countries have been escalating for many years.
In this memo, we describe the key tariffs that impact the solar industry and look at the effect of those tariffs on the sector, both in terms of supply and demand.
US-China Trade Wars, Tariffs and the Solar Industry
During the Obama administration, a 2012 US Department of Commerce1 investigation found that China was inundating, or “dumping”, the US solar market with government-subsidised solar panels. As a result, the US implemented anti-dumping tariffs on some Chinese solar panels.
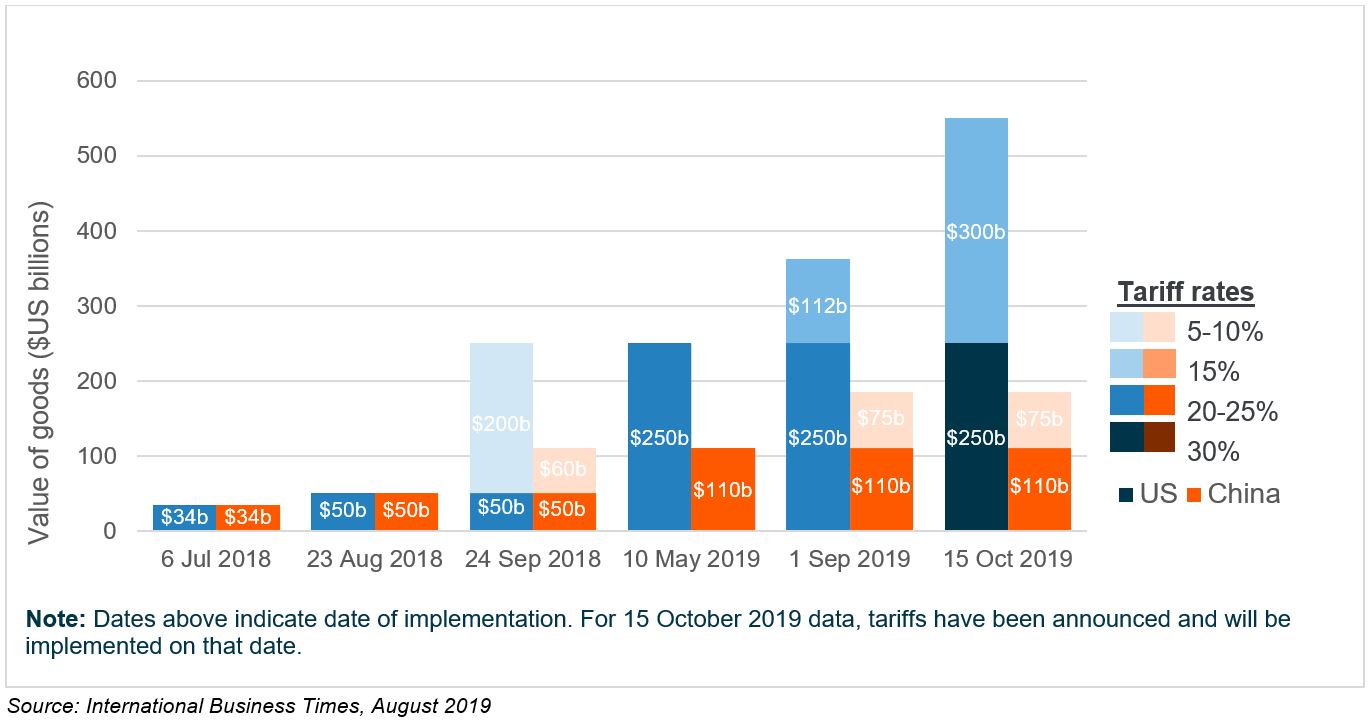
With the election of President Trump, the administration has focused attention on Chinese-American trade relations and the implementation of tariffs has accelerated. In 2017 the US administration applied tariffs to more than $250 billion worth of Chinese goods across various industries. In retaliation, China implemented in-kind tariffs on more than $110 billion worth of US imports. Figure 1 illustrates the course of the trade war, showing bilateral US-China tariffs that have been enacted or announced for 2018 and 2019. As the graph shows, the tariff rates have increased and so has the value of the goods that are subject to the tariffs.
Figure 1: Bilateral tariffs between the US and China since 2018
In addition to bilateral US-China tariffs indicated in the graph above, solar modules imported into the US, regardless of their country of origin, are also subject to Section 201 of the Trade Act of 1974 under which the US President can impose import duties on goods entering the US. In January 2018, this legislation was the basis for the application of a 30% tariff on all imported crystalline silicon PV modules and cells, over and above the first 2.5 GW of imported cells. The tariff steps down annually in 5% increments over four years.
Impact on the US Solar Industry
There are two key questions for solar developers as a result of the impact of the trade war: (i) whether there will be sufficient supply of goods (solar panels) to maintain industry growth and (ii) if supply exists, will the cost of the goods make projects too expensive to pursue.
Supply
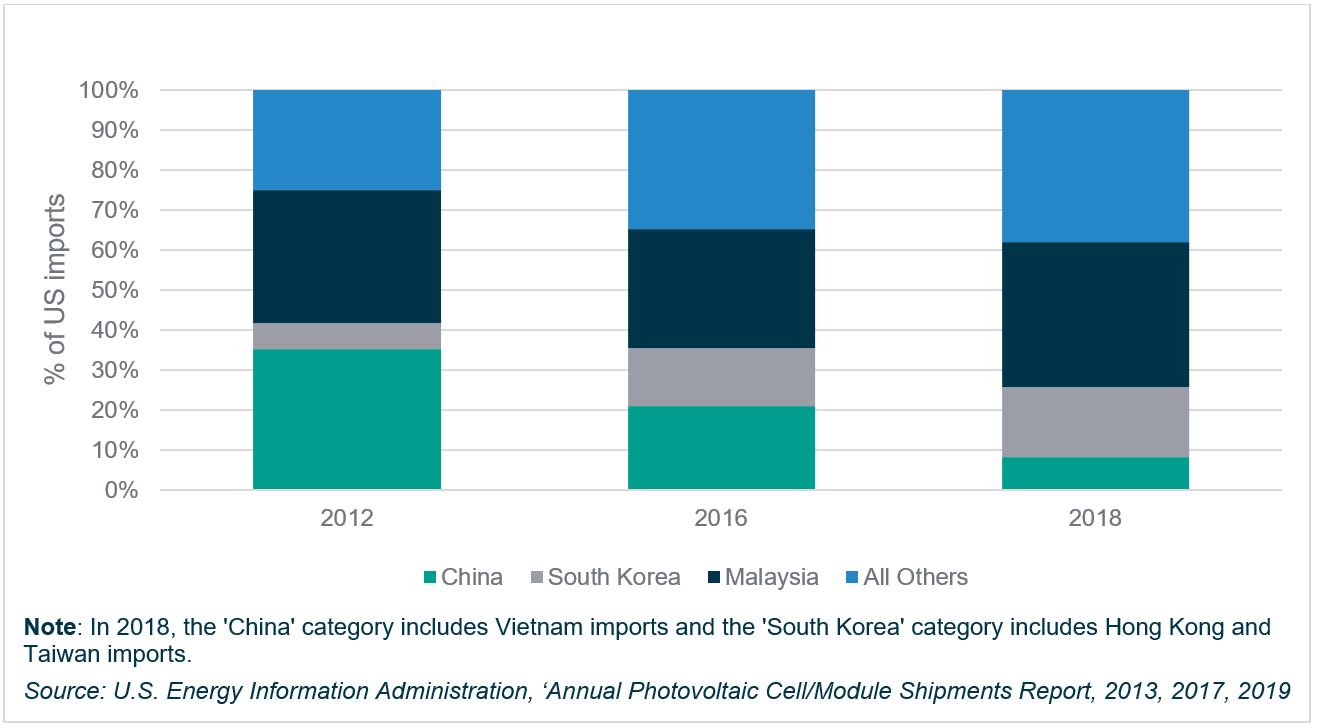
Since the tariffs were initially imposed in 2012, the suppliers of manufactured solar panels have diversified as shown below in Figure 2. China was previously the largest source but sourcing is now increasingly diversified across manufacturing centres in Malaysia, South Korea, Vietnam and China. The increase in the “other” category has also been significant and this category now includes 18 countries.
While some of these new suppliers represent new entrants into solar panel manufacture, much of the apparent diversification is re-configured supply networks of existing manufacturers moving manufacturing to Southeast Asia and South America.
Figure 2: US PV imports in 2012, 2016 and 2018
In addition to a shift in the geographical sources of module imports, the trade war is also influencing the mix of products being produced and supplied. Among the initial exemptions to the section 201 tariffs were products incorporating thin film modules, principally manufactured by First Solar and Solar Frontier, and modules using SunPower’s Interdigitated Back Contact (IBC) PV cells. Demand for these products clearly benefitted from their exemption.
Similarly, on 12 June 2019 when the US announced a round of Section 201 tax exemptions which included bifacial modules industry expert, Wood Mackenzie, advised that they expected 7-8 gigawatts (GW) of Southeast Asia’s module capacity to be retooled from producing mono-facial modules to bifacial modules2 . However, on 7 October 2019, the Trump administration reversed its decision to exempt bifacial solar panels. From 28 October, imported bifacial solar modules are once again subject to the 25% tariff.
Cost
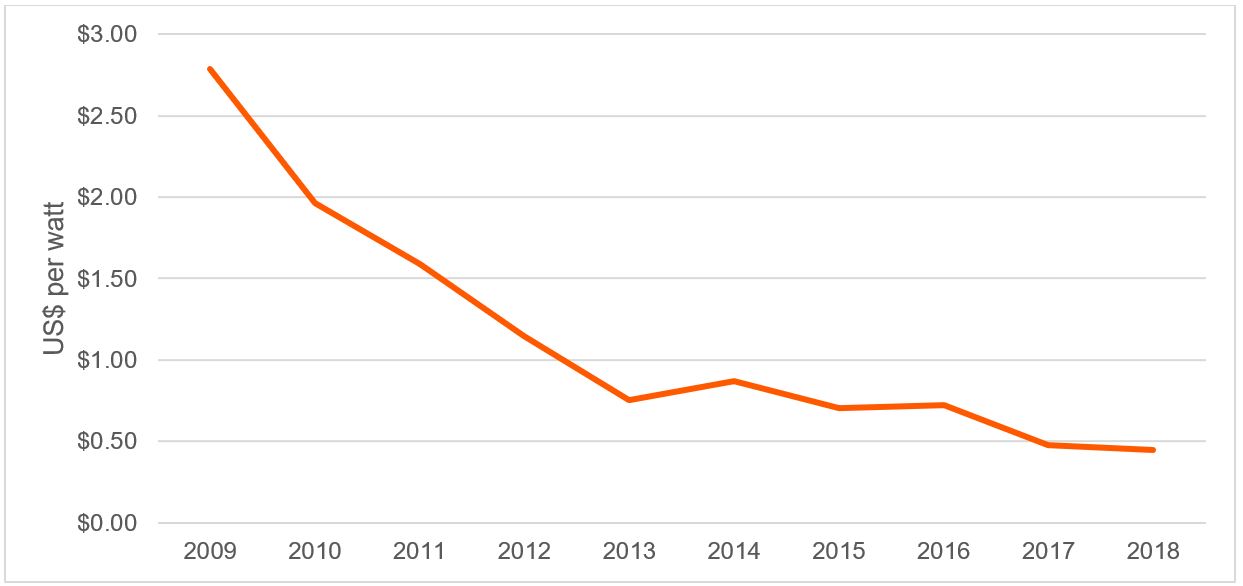
The cost of solar panels has been steadily declining over the last decade, falling 85% since 20103. The decreasing price has been the result of increasing efficiencies in technology, a reduction in the price of raw materials due to economies of scale, and strong consistent demand for renewable energy.
Some market evidence suggests that the application of recent tariffs has increased the purchase price of solar panels in the US and has also created a supply shortage, which is placing additional upward pressure on prices. However, many manufacturers argue that the tariffs have been offset by further advances in technology and that the increased prices are not a sufficient deterrent to the larger trend to renewable energy4.
In fact, further reductions in the cost of solar panels in major international markets, including Asia, Europe and North America, are expected to continue as the global energy sector transitions toward renewables5. We expect that research and development and progress in solar cell architecture and efficiency will continue to support the long-term downward pricing pressure on solar panels despite the US-China trade war.
Figure 3: Average Value of PV Modules
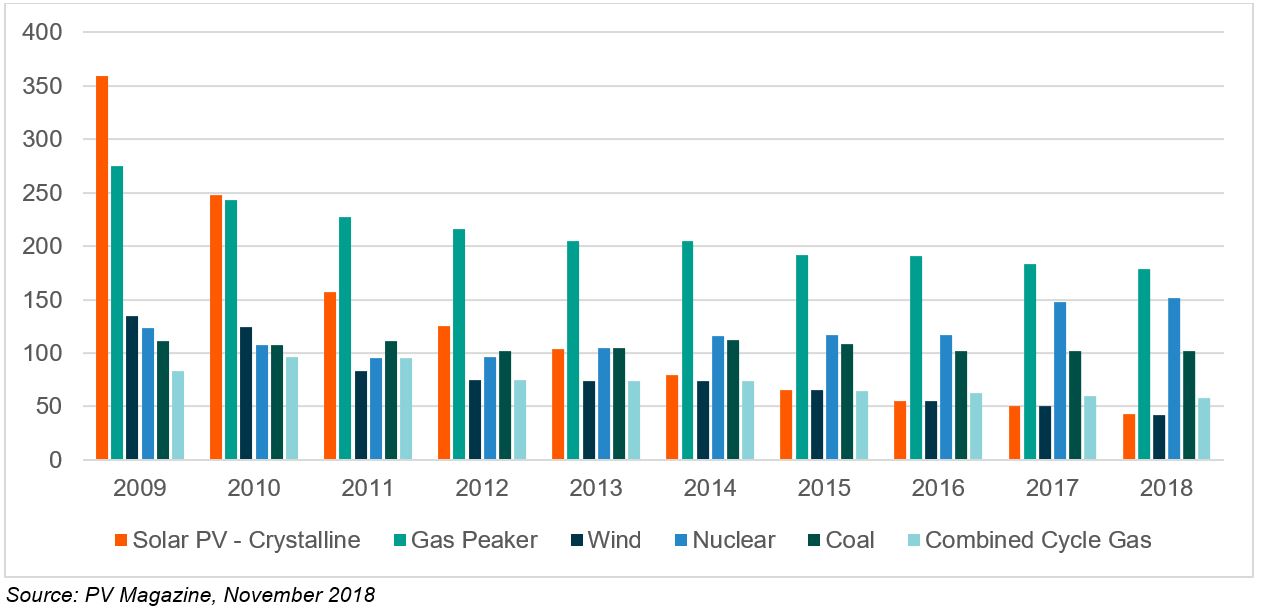
Alongside the declining cost of solar panels, the overall cost of solar plant construction has also declined, even accounting for the application of the tariffs. In many countries, the adoption of solar PV is driven by economics and solar is cost competitive without regulatory or legislative subsidies. In the US today as is evident in the graph below, the cost of solar and wind are roughly equivalent and they are the cheapest forms of new build electricity generation even without subsidies.
Figure 4: US Levelised Cost of Electricity (2009-2018)
Demand
While the US-China trade war is influencing the market for solar components, specifically solar cell technology, the momentum of the transition to clean energy technology appears to be intact. Demand in the US continues to be underpinned by the cost-competitiveness of new build solar generation, government support and corporate purchases of renewable energy.
One of the clearest indicators of the momentum in the sector is the level of corporate power purchase agreements (PPAs) recorded. BloombergNEF6 notes that for the 2019 year to the end of September, global private enterprises and public institutions signed contracts to purchase 13.1GW of clean energy, approximately 4.4GW more than were signed by the same point in 2018. Importantly, the Americas (US, Chile, Argentina) dominate activity, accounting for 80% of global activity in this period.
Conclusion
The regulatory environment for a rapidly expanding market such as solar is understandably dynamic but the trade war has heightened uncertainty generally, particularly in periods between the threat of trade barriers and the imposition of tariffs.
However, since the imposition of the initial tariffs on solar products in 2012, we have seen the solar power market adapt to the challenges. In terms of supply, the range of manufacturing centres has expanded and diversified and prices have continued to come down for solar PV modules, making them increasingly smaller portions of the overall cost of solar power plants. In terms of demand, the appetite for solar energy has steadily increased and continues to be driven by the cost-competitiveness of solar, government support and a growing market for corporate PPAs for solar power. As a result, we believe that the unpredictability and consequent uncertainty around the US-China Trade War is largely mitigated by the supply and demand dynamics of the US solar industry which has adapted well and continues to grow despite this political volatility.
1. See report of US Department of Commerce findings and measures imposed in “31 Percent Anti-dumping Tariffs Announced for Chinese Solar Panels” Renewable Energy World 17 May 2012.
2. “Bifacial market to grow tenfold by 2024”, by Xiaojing Sun, Senior Research Analyst, Global Solar, Wood Mackenzie 24 September 2019
3. “Solar and Wind Power So Cheap They’re Outgrowing Subsidies” by Mark Chediak and Brian Eckhouse, Bloomberg LP September 19 2019
4. “Solar Energy Execs Say They’re Dodging the Effects of Trump’s Trade War Tariffs” Fortune, September 6, 2019
5. “Why PV Costs Have Fallen So Far – and Will Fall Further, Solar Innovation is Still Very Strong” by Jason Deign Greentech Media, December 14, 2018
6. Bloomberg NEF Corporate PPA Deal Tracker September 2019

